
On the Street Monthly – The Best Part of the Cycle Is Here
October 2026
The Best Part of the Cycle Is Here
Inside: The Strongest Stretch of the Four-Year Cycle, Three Reasons Yields Hit 5%, and Where AI Earnings Are Actually Showing Up.
Markets
The Best Part of the Cycle Is Here
S&P 500, year to date
+11.8%
Entering October
October average, midterm years
+3.0%
Higher about 74% of the time
In our August newsletter, we pointed out that August and September have historically been the two weakest months of a midterm election year. This year followed the script. The S&P 500 slipped 0.5% in September and gained only 2% over the past three months, though it is still up 11.8% for the year entering October.
The good news is what usually comes next. The chart below from Carson Investment Research tracks the average path of the S&P 500 through a four-year presidential term going back to 1928. The highlighted stretch, the fourth quarter of a midterm year through the first half of the following year, has historically been the strongest part of the entire cycle.
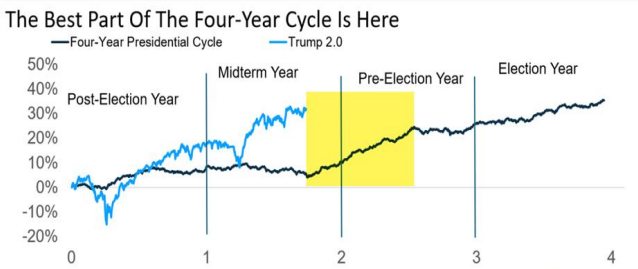
Source: Carson Investment Research.
October has averaged a 3.0% gain in midterm years and has been higher about 74% of the time, and November has risen 80% of the time. There is a second tailwind. Carson found 21 years when the S&P 500 entered the fourth quarter up between 10% and 20%, right where we are now, and the fourth quarter was higher more than 85% of the time with an average gain above 5%.
None of this is a guarantee, and 2018, when stocks fell 7% in October of a midterm year, is a reminder that the pattern can break. But after two months of the calendar working against investors, it is now entering a period when it typically works for them.
Fixed Income
Why 5% Now?
10-year Treasury yield
5.29%
September month-end
Sector correlation reading
0.60
Below the 0.78 long-term average
The 10-year Treasury yield, which helps set rates on everything from mortgages to business loans, climbed above 5% in September and ended the month at 5.29%. Why now? We see three simple reasons.
First, demand for money is up. Tech companies are borrowing heavily to build AI data centers, and when more people want to borrow, the price of borrowing rises. Second, the economy has held up. Big oil spikes have usually caused recessions, which pull rates down, but this time the economy kept growing. Third, the Fed is no longer buying bonds to keep rates low, so rates are settling closer to where the market thinks they belong.
So are stock investors worried? One way to tell is whether different parts of the market are moving together. When investors are calm, sectors go their own way. When they get nervous, everything tends to fall at once. The chart below tracks this: lower means calmer, higher means more fear.

Source: DataTrek Research.
The reading hit a low of 0.36 in August, a sign investors had gotten very relaxed. Higher rates have since pushed it up to 0.60, but it is still below the long-term average of 0.78. In other words, investors are paying attention without panicking, which is usually a healthier setup for stocks than when everyone is too comfortable.
Earnings
AI Earnings: Chips Lead, Software Lags
Semiconductors
+16.5%
Next-year estimates
Software
+3.2%
Next-year estimates
Big Tech ex-NVDA/TSLA
+1.8%
Next-year estimates
Third quarter earnings season starts next week, and expectations are high, with Goldman Sachs forecasting 27% profit growth for the S&P 500. Ahead of the reports, we looked at how analysts have changed their profit estimates over the past 90 days for the three groups driving the AI boom: the biggest tech companies, software and semiconductors. The table below shows the 10 largest chip companies.
| Name | Symbol | Weight | Current Year | Next Year | YTD Return | Fwd P/E (NTM) |
|---|---|---|---|---|---|---|
| Nvidia | NVDA | 19.4% | 4.1% | 25.2% | 27.3% | 19.7 |
| Taiwan Semi | TSM | 9.4% | 6.5% | 8.6% | 55.4% | 23.7 |
| AMD | AMD | 5.5% | 2.7% | 19.1% | 201.6% | 57.5 |
| Broadcom | AVGO | 5.2% | 0.3% | -0.4% | 8.8% | 21.7 |
| Applied Materials | AMAT | 4.7% | 4.5% | 12.5% | 102.6% | 29.4 |
| Micron | MU | 4.7% | 17.4% | 26.3% | 281.2% | 6.2 |
| KLA | KLAC | 4.6% | 6.6% | 9.6% | 61.9% | 35.5 |
| Texas Instruments | TXN | 4.6% | 8.8% | 11.1% | 66.6% | 30.5 |
| Lam Research | LRCX | 4.5% | 17.3% | 18.4% | 92.5% | 34.9 |
| Intel | INTC | 4.5% | 39.4% | 35.1% | 206.6% | 67.2 |
| Sum/Average | 67.1% | 10.8% | 16.5% | 110.4% | 32.6 |
Source: DataTrek Research. Weight is the holding’s share of the SMH ETF.
Chip makers stand out. Analysts raised next year’s estimates by 16.5% on average, led by Micron, Nvidia and AMD. Software estimates rose just 3.2%, and some of the year’s biggest software winners, like CrowdStrike, have rallied even as their estimates were cut. For Big Tech outside of Nvidia and Tesla, next year’s estimates are up only 1.8%.
The takeaway is that AI profits are showing up in specific places, not across all of tech. Chip makers now face a high bar, while software and much of Big Tech have room to surprise. Either way, what companies say about next year will matter more than usual this quarter.
Data
Market Snapshot
For the month ending 9/30/2026 (cumulative returns)
| 1-Month | 3-Month | YTD | 1-Year | |
|---|---|---|---|---|
| Dow Jones Industrial Average | -4.29% | -2.70% | 5.91% | 9.72% |
| S&P 500 | -0.45% | 2.03% | 11.77% | 14.40% |
| NASDAQ Composite | 1.86% | 2.47% | 15.57% | 18.54% |
| U.S. Mid Cap | -3.99% | -1.82% | 15.25% | 15.29% |
| U.S. Small Cap | -4.97% | -5.39% | 10.52% | 13.83% |
| 1-Month | 3-Month | YTD | 1-Year | |
|---|---|---|---|---|
| Nikkei 225 | 0.67% | -4.72% | 32.61% | 48.56% |
| Hang Seng | -3.73% | 7.57% | -3.97% | -8.35% |
| Shanghai Composite | -3.61% | -6.16% | -3.19% | -1.05% |
| FTSE 100 | -2.02% | 1.04% | 6.79% | 13.43% |
| DAX | -4.03% | 0.81% | 2.89% | 5.52% |
| 1-Month | 3-Month | YTD | 1-Year | |
|---|---|---|---|---|
| Corporate Bonds | -3.39% | -5.18% | -4.35% | -4.03% |
| Municipal Bonds | -3.54% | -5.29% | -3.57% | -1.97% |
| High Yield Bonds | -2.73% | -2.00% | -0.34% | 0.89% |
| Rate | |
|---|---|
| 10 Year Treasury | 5.29% |
| Fed Funds (Effective) | 4.21% |
| Inflation Rate | 3.40% |
| Unemployment Rate | 4.10% |
| Value | |
|---|---|
| WTI Crude Oil | $90.42 |
| Gold ($/oz) | $4,186.70 |
| U.S. Dollar Index | 101.45 |
| CBOE Volatility Index | 16.34 |
Source: FactSet Research Systems Inc.; YCharts, Inc.; U.S. Bureau of Labor Statistics. Corporate Bonds, Municipal Bonds and High Yield Bonds are presented via representative iShares ETFs (LQD, MUB, HYG). Past performance is no guarantee of future results.
In the News
Articles We’re Reading
- Anthropic is seeking to IPO as soon as the middle of November. Bloomberg
- Fed’s Kashkari reaffirms inflation is still too high despite lower inflation data. The Hill
- The average 30-year fixed-rate mortgage jumps to 7.28%, the highest since November 2023. NY Times
- Citadel strategists predict retail investors will return to US stocks in October as earnings and buybacks return. Bloomberg
■ Did You Know?
Twenty-five years ago this month, the 30-year Treasury bond briefly stopped existing.
On October 31, 2001, after several years of federal budget surpluses, the Treasury announced it would no longer issue the “long bond” because it no longer needed to borrow that far out. Traders were stunned, and the 30-year yield fell from 5.21% to 4.87% in a single day, an enormous move for the bond market. The announcement also produced an insider trading case. The news was embargoed until 10:00 a.m., but a Washington consultant who attended the Treasury’s briefing started phoning clients at 9:28. Traders at two investment firms bought well over $100 million of the bonds in the minutes before the release, and Goldman Sachs later paid $9.3 million to settle charges with the SEC. The hiatus did not last. Once deficits returned, the Treasury brought the 30-year back in February 2006, and today it is once again one of the most closely watched rates in the world.
