On the Street Monthly – Oil Speak Leads to Turbulent Markets
With rising tensions in the Middle East, WTI Crude prices have jumped over 90% in the first quarter of 2026, putting energy back in the headlines. That got us looking back at history to see how markets have typically handled oil spikes, and what it might mean for investors today.
The short answer is that not every oil shock plays out the same way. Looking back at major crude price spikes since 1973, the market reactions have varied widely depending on one key factor: whether the oil shock was the main problem, or whether it was piling on top of an already stressed economy. The 1990 Gulf War sent oil surging and stocks dropped 20%, but once the conflict ended and supply came back online, the market recovered quickly. The 2005 Hurricane Katrina spike knocked out a quarter of U.S. oil production and the S&P 500 barely flinched.

The episodes that caused real, lasting damage were the ones where rising oil prices arrived alongside something bigger, like the stagflation of the 1970s or the 2008 financial crisis. In those cases, oil was one of several serious problems happening at once.
For now, the situation in the Middle East bears watching, but a spike in crude prices alone has not historically been enough to derail markets for long.
Midterm Election Year Volatility
After a difficult March, it helps to zoom out and look at how often pullbacks like this happen, because history is more reassuring than the headlines suggest.
The S&P 500 has declined 9% from its January 28, 2026 peak. That puts us just shy of the formal 10% correction threshold, but well within the range of normal market behavior. On average, the S&P 500 experiences a full 10% correction about once per year. Steeper declines follow a similar pattern: 15% drawdowns occur roughly every two years, and 20% bear markets arrive about every three and a half years.
What history also shows is something easy to forget in the middle of a drawdown: the market has recovered from every single one of them. Pullbacks are not a sign that something has broken. They are a recurring feature of long-term investing, and historically, they have been more often an opportunity than a reason to exit.

(Source: S&P 500 Index Data)
What is also worth noting is that midterm election years tend to see more pronounced declines than the average year. As the table above shows, going back to 1950 the average maximum drawdown in a midterm election year has been 16.1%. Yet in every single instance, the market was higher 12 months later, with an average forward return of 36.4%. The current 9% pullback, while uncomfortable, is actually below the historical midterm average, and history suggests the year ahead could look quite different from the year behind.
Tech Premium Erased
For much of the past seven years, technology stocks commanded a substantial premium over the broader market. At the start of 2019, tech traded at roughly the same valuation multiple as the S&P 500. That parity did not last long. A sustained period of low interest rates inflated growth stock multiples, and the emergence of generative AI in late 2022 sent technology valuations to extraordinary levels. By June 2024, the sector traded at a 47% premium to the broader index.
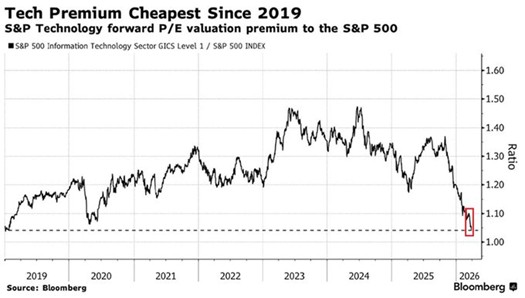
That premium has now been fully unwound. Software stocks fell approximately 25% in Q1 2026, and technology as a whole has reverted to 2019-era valuations. At the current pace, the sector is on track to trade at a discount to the S&P 500 for the first time since 2017.
The uncertainty fueling the selloff is real. AI is increasingly viewed as a competitive threat to the recurring-revenue software business model that drove so much of tech’s outperformance over the past decade. But it is worth noting that the technology sector has been the strongest driver of U.S. equity returns over the past two decades and is now, by historical standards, attractively priced. For long-term investors, the question shifts from whether tech is too expensive to whether the long-term growth story remains intact.
Articles We’re Reading
Iran and Oman are drafting a protocol to monitor transit through the Strait of Hormuz (CNBC)
Tesla Q1 deliveries down 14% from prior quarter, below Street expectations (CNBC)
MIT paper says AI is going to change the way people work, but not going to replace them en masse (Axios)
Trump looking to boost defense spending to $1.5T in 2027, up from the nearly $1T in 2026 (Yahoo)
Market Snapshot
For the Month Ending 3/31/2026 (Cumulative Returns)1

1Source – Morningstar, Inc. Corporate Bonds is presented as the iShares iBoxx $ Investment Grade Corporate Bond ETF. Municipal Bonds is presented as the iShares National Municipal Bond ETF. High Yield Bonds is presented as the iShares iBoxx $ High Yield Corporate Bond ETF. 10 Year Treasury refers to the valuation of a 10 Year Treasury Note, a debt obligation issued by the U.S. Department of the Treasury. Fed Funds Target represents upper limit of the federal funds target range established by the Federal Open Market Committee. Inflation Rate provided for the purposes of this report by the U.S. Bureau of Labor Statistics. Unemployment Rate calculated by the U.S. Bureau of Labor Statistics. WTI Crude Oil refers to the price of a barrel of West Texas Intermediate NYMEX) Crude Oil. Gold – Spot Price relates to the valuation of an ounce of gold, as traded on the NYSE Arca Exchange. U.S. Dollar refers to the U.S. Dollar Index (DXY). All Returns are denominated in USD (United States Dollar), unless otherwise explicitly noted.
Did You Know?
As the 2026 season gets underway, it is worth remembering that professional baseball has been an American pastime for over 150 years. The National Association of Professional Base Ball Players played its opening games in April 1871. Back then, a ticket cost 50 cents, rosters had no set size, and players could switch teams freely mid-season. What has not changed is that April marks the beginning of spring and also the start of America’s pastime.
Presented by the Investment Committee of Lake Street, an SEC Registered Investment Adviser
The information contained herein constitutes general information and is not directed to, designed for, or individually tailored to, any particular investor or potential investor. This report is not intended to be a client-specific suitability analysis or recommendation, an offer to participate in any investment, or a recommendation to buy, hold or sell securities. Do not use this report as the sole basis for investment decisions. Do not select an asset class or investment product based on performance alone. Consider all relevant information, including your existing portfolio, investment objectives, risk tolerance, liquidity needs and investment time horizon. Diversification does not ensure a profit or guarantee against a loss. There is no assurance that any investment strategy will be successful. Investing involves risk and you may incur a profit or a loss.