On the Street Monthly – Markets Brace as Iran Conflict Spurs Oil Surge
With headlines focused on the recent invasion in Iran, markets are weighing a range of potential ripple effects — most notably the sharp move higher in oil prices. As WTI crude climbs, inflation expectations tend to rise as well, pushing bond yields higher as investors price in fewer potential rate cuts. Even with a new Federal Reserve Chair, Kevin Warsh, stepping in this May, it may prove difficult to justify easing policy if inflation pressures reaccelerate alongside energy costs.
As investors assess how geopolitical tensions may unfold, we revisited how markets historically perform following back-to-back daily gains of more than 5% in WTI crude.

(Source: The Compound Media)
Since 1990, this has occurred 13 times, including the current episode. In the prior 12 instances, the S&P 500 finished higher 10 times over the following 12 months, with an average gain of 21.9%. That may seem counterintuitive given that oil shocks are often viewed as destabilizing events. Most recently, in 2022 following Russia’s invasion of Ukraine, markets faced persistent inflation, aggressive rate hikes, and meaningful declines in both stocks and bonds. Still, with current economic data remaining relatively firm, history suggests that while oil spikes can create short-term volatility, they have not consistently derailed markets over a longer time horizon.
AI Disruption Reshapes Market Leadership
February felt like a steady drumbeat of headlines highlighting how artificial intelligence is disrupting one industry after another. Nowhere has that impact been more visible than in software stocks. While the S&P 500 remained positive through the first two months of the year, software names declined nearly 21% over the same period creating a stark divergence beneath the surface of the index.

(Source: Y-Charts)
At the start of the year, software companies represented roughly 12% of the S&P 500, but after the recent selloff, that weight has fallen closer to 8%. Despite that meaningful drag, the broader index has held up, underscoring strength in other areas of the market. In fact, the performance gap between software and semiconductor stocks over the past 50 trading days has widened to roughly 30%, a spread not seen in the last 15 years.
While AI-driven disruption is clearly reshaping the competitive landscape, such extreme relative performance historically has not persisted indefinitely. At these levels, a rebound in software stocks would not be surprising as positioning and sentiment reset.
International Stocks Extend Leadership Over the US
In 2025, a weakening U.S. dollar combined with increased fiscal investment from governments abroad helped fuel strong relative performance for international equities. That trend has carried into early 2026, with non-U.S. markets continuing to outpace their U.S. counterparts.
The chart below highlights the 50-day trailing return spread between the MSCI All Country World ex-U.S. Index (ACWX) and the S&P 500.
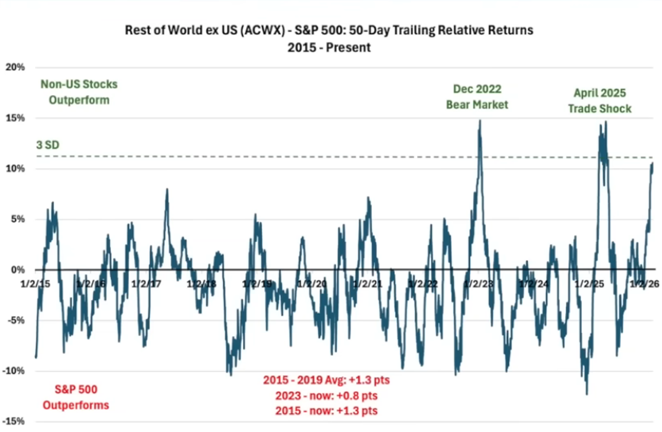
(Source: DataTrek)
When the blue line rises, international stocks are outperforming U.S. equities. Historically, we’ve only seen moves of this magnitude during notable stress periods such as the 2022 bear market and the April 2025 trade shock both of which approached a three standard deviation extreme. In those prior cases, performance leadership eventually rotated back toward U.S. stocks. As of the end of February, the current divergence is once again nearing that threshold, suggesting positioning may be becoming crowded.
While we continue to see merit in maintaining international exposure, a period of short-term mean reversion would not be surprising.
Articles We’re Reading
Nvidiato unveil new Groq-designed chip focused on AI inference computing at upcoming GTC (Reuters)
New Berkshire Hathaway CEO Greg Abel says massive cash holdings not a sign that the conglomerate is retreating from dealmaking (FT)
OpenAI says it has reached agreement with Pentagon to provide its AI technologies for classified systems; says deal adheres to its safety principles (NY Times)
Amazonemployees highlight mounting pressure and slumping morale following big job cuts, don’t see AI doing anyone’s job (FT)
Market Snapshot
For the Month Ending 2/28/2026 (Cumulative Returns)1
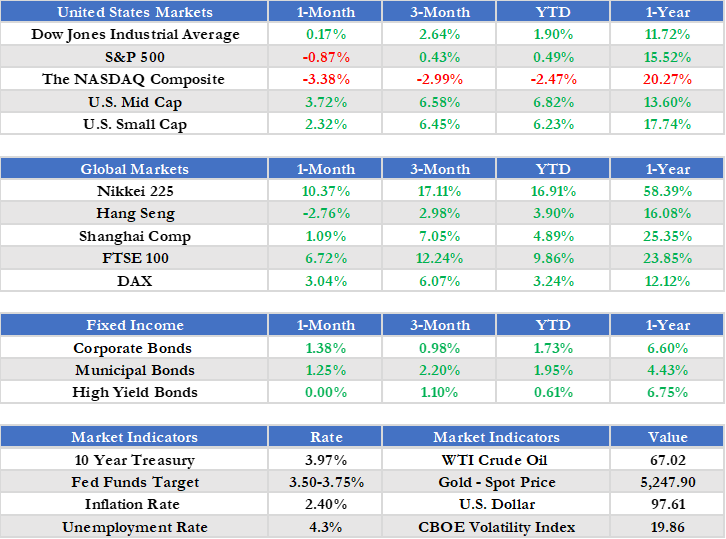
1Source – Morningstar, Inc. Corporate Bonds is presented as the iShares iBoxx $ Investment Grade Corporate Bond ETF. Municipal Bonds is presented as the iShares National Municipal Bond ETF. High Yield Bonds is presented as the iShares iBoxx $ High Yield Corporate Bond ETF. 10 Year Treasury refers to the valuation of a 10 Year Treasury Note, a debt obligation issued by the U.S. Department of the Treasury. Fed Funds Target represents upper limit of the federal funds target range established by the Federal Open Market Committee. Inflation Rate provided for the purposes of this report by the U.S. Bureau of Labor Statistics. Unemployment Rate calculated by the U.S. Bureau of Labor Statistics. WTI Crude Oil refers to the price of a barrel of West Texas Intermediate NYMEX) Crude Oil. Gold – Spot Price relates to the valuation of an ounce of gold, as traded on the NYSE Arca Exchange. U.S. Dollar refers to the U.S. Dollar Index (DXY). All Returns are denominated in USD (United States Dollar), unless otherwise explicitly noted.
Did You Know?
The term “March Madness” didn’t start with the NCAA Division I Men’s Basketball Tournament. It began in 1939 with Illinois high school basketball. That year, Henry V. Porter of the Illinois High School Association used the phrase in an essay to describe the fever-pitch excitement surrounding the state tournament. At the time, Illinois ran a single-class format, meaning tiny rural schools competed against big-city programs, creating dramatic David vs. Goliath matchups. The tournament regularly packed arenas, and by the 1930s, championship games were drawing crowds approaching 15,000 fans.
Ironically, 1939 was also the year of the first NCAA men’s basketball tournament, which featured just eight teams and far less fanfare. It would take decades before the NCAA adopted the “March Madness” nickname, eventually turning it into one of the most recognized brands in sports. But the phrase and the frenzy behind it was born in Illinois high school gyms, where packed stands and last-second shots first defined the madness of March.
Presented by the Investment Committee of Lake Street, an SEC Registered Investment Adviser
The information contained herein constitutes general information and is not directed to, designed for, or individually tailored to, any particular investor or potential investor. This report is not intended to be a client-specific suitability analysis or recommendation, an offer to participate in any investment, or a recommendation to buy, hold or sell securities. Do not use this report as the sole basis for investment decisions. Do not select an asset class or investment product based on performance alone. Consider all relevant information, including your existing portfolio, investment objectives, risk tolerance, liquidity needs and investment time horizon. Diversification does not ensure a profit or guarantee against a loss. There is no assurance that any investment strategy will be successful. Investing involves risk and you may incur a profit or a loss.