On the Street – What January’s Performance May Signal for 2026
As we wrapped up the first month of 2026, the S&P 500 posted a gain of 1.5%. There are several indicators that occur early in the year that have historically provided insight into how the remainder of the year may unfold. One of the most well-known is the “January Indicator,” which examines how January’s performance has tended to set the tone for the rest of the year.
The chart below shows market performance following years in which January finished up between 0% and 2% dating back to 1950. In 2026, January marked the 14th occurrence of a gain in that range. In the prior 13 instances, the market finished higher over the remaining 11 months in 12 of those years.
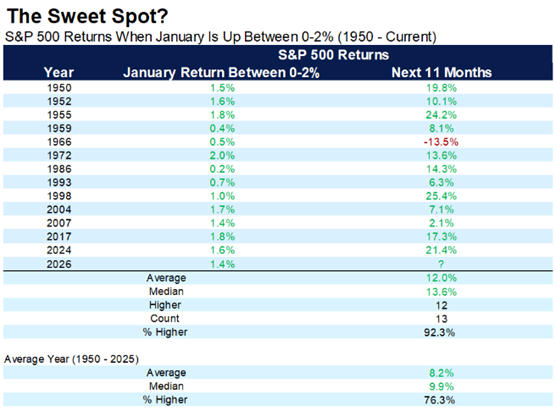
(Source: Carson Insights)
The lone exception was 1966, a period characterized by rising inflation and a sharp increase in interest rates, which ultimately led to a 22% market decline from February highs to October lows. While inflation and interest rates remain key considerations today along with the transition to a new Federal Reserve Chair in May, historically, January’s return has been a constructive signal and would point toward a positive year for equities.
Margin Debt Rising
One sign of increasing investor optimism, or even euphoria, in the stock market is rising margin debt, which occurs when investors borrow money to purchase additional stocks. Elevated margin balances can amplify gains, but they also increase risk if markets reverse.
The chart below compares the S&P 500, shown in blue, to FINRA margin balances outstanding, shown in red, with both adjusted for shares currently in circulation. The key takeaway is how markets have historically behaved when margin balances rise above equity market levels and what has followed in those periods.
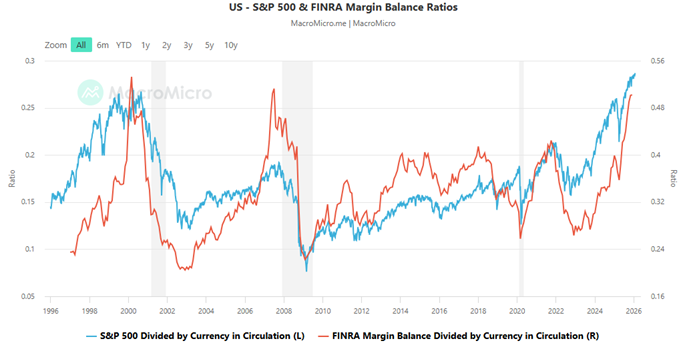
(Source: MacroMicro)
This pattern appeared ahead of several major market downturns, including the dot-com bubble in 2000, the Global Financial Crisis in 2008, and again in late 2021 following the meme-stock surge. It is also important to note that from roughly 2010 to 2018, margin debt remained elevated for an extended period while markets continued to perform well.
While rising margin debt is not a precise timing tool, it has historically served as a useful warning signal ahead of periods of increased volatility. As such, it is an indicator worth monitoring alongside broader market and economic conditions.
US ISM Manufacturing & Services PMI
Two key economic indicators that help gauge the direction of the U.S. economy are the ISM Manufacturing PMI and the ISM Services PMI. The Manufacturing PMI measures whether U.S. factories are expanding or contracting and represents roughly 11% of U.S. GDP. The Services PMI, which covers a much larger portion of the economy, accounts for more than 70% of total GDP.
Readings below 50 typically indicate contraction and often lead to increased discussion around a potential recession. Readings above 50, particularly when trending higher, signal expansion and improving economic conditions.
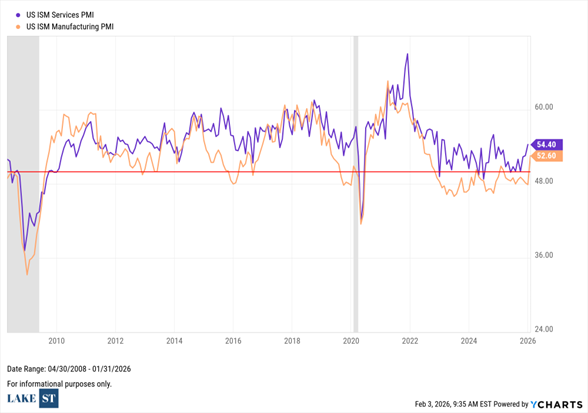
(Source: Y-Charts)
The chart above shows the most recent readings for both indicators. In the latest report, each index increased from prior levels, with ISM Manufacturing notably moving back above the 50 threshold and registering a reading of 52.60. While economic data and stock market performance are not always perfectly correlated, these readings are encouraging and suggest the economy may be on firmer footing.
Articles We’re Reading
Waymoclose to finalizing $16B funding round that will more than double the value to $110B (FT)
Stanley Druckenmiller says notion that Fed Chair nominee Warsh is always hawkish is not correct, open to Greenspan view that growth can came without inflation (FT)
CME raises gold and silver margins by 200 bp (to 8%) and 140 bp (to 8.8%) following big Friday selloff (CNBC)
Exxon Mobil, Chevron talk up long-term opportunities in Venezuela but reluctant to commit new capital before political and legal reform (Bloomberg)
Market Snapshot
For the Month Ending 1/31/2026 (Cumulative Returns)1
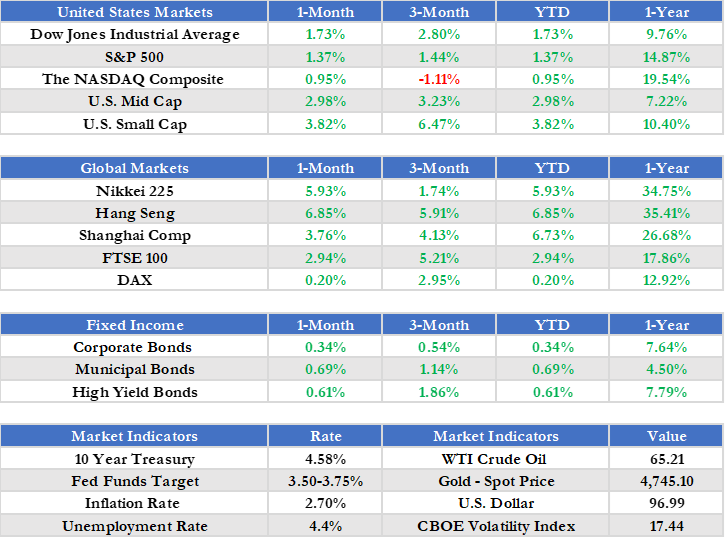
1Source – Morningstar, Inc. Corporate Bonds is presented as the iShares iBoxx $ Investment Grade Corporate Bond ETF. Municipal Bonds is presented as the iShares National Municipal Bond ETF. High Yield Bonds is presented as the iShares iBoxx $ High Yield Corporate Bond ETF. 10 Year Treasury refers to the valuation of a 10 Year Treasury Note, a debt obligation issued by the U.S. Department of the Treasury. Fed Funds Target represents upper limit of the federal funds target range established by the Federal Open Market Committee. Inflation Rate provided for the purposes of this report by the U.S. Bureau of Labor Statistics. Unemployment Rate calculated by the U.S. Bureau of Labor Statistics. WTI Crude Oil refers to the price of a barrel of West Texas Intermediate NYMEX) Crude Oil. Gold – Spot Price relates to the valuation of an ounce of gold, as traded on the NYSE Arca Exchange. U.S. Dollar refers to the U.S. Dollar Index (DXY). All Returns are denominated in USD (United States Dollar), unless otherwise explicitly noted.
Did You Know?
The Indiana Hoosiers capped one of the most remarkable seasons in college sports history by finishing 16–0 and winning the College Football Playoff national championship which is the first undefeated season of its kind since the 1894 Yale Bulldogs in football, marking a stunning turnaround under coach Curt Cignetti after decades of struggles.
And for men’s college basketball, the last team to complete a perfect undefeated season was the 1975–76 Indiana Hoosiers team, which went 32–0 and won the NCAA title under coach Bob Knight, a feat no Division I team has matched since.
Presented by the Investment Committee of Lake Street, an SEC Registered Investment Adviser
The information contained herein constitutes general information and is not directed to, designed for, or individually tailored to, any particular investor or potential investor. This report is not intended to be a client-specific suitability analysis or recommendation, an offer to participate in any investment, or a recommendation to buy, hold or sell securities. Do not use this report as the sole basis for investment decisions. Do not select an asset class or investment product based on performance alone. Consider all relevant information, including your existing portfolio, investment objectives, risk tolerance, liquidity needs and investment time horizon. Diversification does not ensure a profit or guarantee against a loss. There is no assurance that any investment strategy will be successful. Investing involves risk and you may incur a profit or a loss.