On the Street Monthly – What has Driven 2025s Gains?
As we enter the final stretch of 2025, markets have taken investors on a ride. After sharp volatility in April following tariff announcements, stocks rebounded and delivered seven straight months of gains. November finished only slightly positive, recovering from an early 6% pullback. Now, as we move through December, a month that historically favors the stock market, we wanted to highlight what has actually driven returns this year.
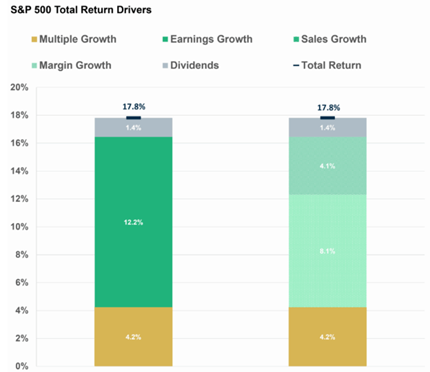
(Source: Carson Insights)
The chart above breaks down where the S&P 500’s performance has come from. Despite talk of a “bubble” during November’s brief decline, most of this year’s gains have not come from rising valuations. In fact, valuation expansion (or “multiple expansion”) has contributed only 4.2% of the S&P’s return, far lower than what we saw during the dot-com era, when enthusiasm around the internet pushed valuations to extreme levels. Instead, earnings growth has been the primary driver, accounting for 12.2% of 2025’s gains. Dividends added another 1.4%.
While it’s possible an AI-driven bubble could emerge in the future, the current market environment is being supported mostly by improving corporate earnings, which is a healthier foundation for long-term growth. If we begin to see valuation expansion dominate returns, that could be a warning sign. But so far in 2025, that’s not what’s happening.
Wall of Worry
Warren Buffett famously said, “Be greedy when others are fearful, and fearful when others are greedy.” It remains one of the most well-known investing quotes because it highlights how important investor sentiment can be. This is why we pay close attention to how investors are feeling throughout the year.
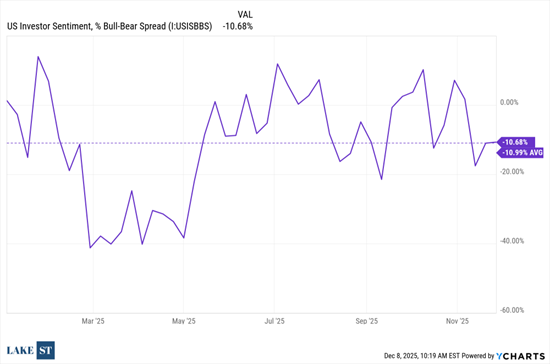
(Source: Y-Charts)
The chart above shows U.S. investment sentiment for 2025 through November 30. For most of the year, about 75 percent of the time, investors were more bearish (fearful) than bullish. On average in 2025, there were 10.99 percent more bears than bulls.
We believe this negative sentiment has played a major role in supporting market returns this year. When investors crowd onto one side of the boat, it can set the stage for stronger market performance once conditions improve. Earnings growth remains the long-term driver of stock returns, but sentiment often influences shorter-term moves.
This will continue to be something we watch closely as we head into 2026.
Employment Backdrop
During the government shutdown, the flow of economic data slowed significantly. As reporting normalizes, we are taking a closer look at two important indicators of labor-market health: ADP Employment Change, which tracks net private-sector job growth, and Challenger Job Cuts, which monitors announced layoffs. The chart below highlights the trends in both metrics from 2022 through the end of November.

(Source: Y-Charts)
This labor market has often been described as a “slow hirer, slow firer.” However, we are now seeing net new private-sector job creation turn negative alongside a recent uptick in unemployment. If this weakness remains contained, it could support additional Fed rate cuts—potentially a tailwind for markets. If deterioration accelerates, it may introduce broader market risks. As we move into 2026, the employment landscape will remain a critical area to watch, especially as AI adoption continues to reshape workforce dynamics.
Articles We’re Reading
Microsoft in talks to shift custom chip business to Broadcom from Marvell(The Information)
UBSmay cut an additional 10K jobs by 2027, according to Swiss paper SonntagsBlick (Reuters)
French President Macro warns EU may be forced to take ‘strong measures’ against China, including tariffs, if Beijing fails to address widening trade imbalance (Bloomberg)
Jump in natural gas prices adding to broader affordability concerns in US (FT)
Market Snapshot
For the Month Ending 11/30/2025 (Cumulative Returns)1
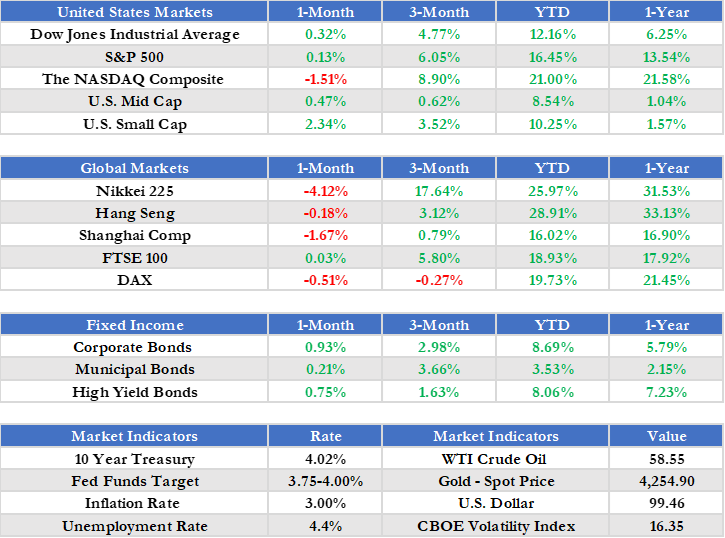
1Source – Morningstar, Inc. Corporate Bonds is presented as the iShares iBoxx $ Investment Grade Corporate Bond ETF. Municipal Bonds is presented as the iShares National Municipal Bond ETF. High Yield Bonds is presented as the iShares iBoxx $ High Yield Corporate Bond ETF. 10 Year Treasury refers to the valuation of a 10 Year Treasury Note, a debt obligation issued by the U.S. Department of the Treasury. Fed Funds Target represents upper limit of the federal funds target range established by the Federal Open Market Committee. Inflation Rate provided for the purposes of this report by the U.S. Bureau of Labor Statistics. Unemployment Rate calculated by the U.S. Bureau of Labor Statistics. WTI Crude Oil refers to the price of a barrel of West Texas Intermediate NYMEX) Crude Oil. Gold – Spot Price relates to the valuation of an ounce of gold, as traded on the NYSE Arca Exchange. U.S. Dollar refers to the U.S. Dollar Index (DXY). All Returns are denominated in USD (United States Dollar), unless otherwise explicitly noted.
Did You Know?
Wall Street’s tradition of publishing stock market forecasts dates back to the early 1900s, when firms began issuing annual outlooks to help investors navigate a rapidly evolving financial market. One of the earliest widely cited examples came from Dow Jones & Company, whose editors at The Wall Street Journal offered year-ahead market commentary that helped establish the forecasting culture we still see today.
Forecasts can vary widely from firm to firm and they often miss the mark, yet investors still look forward to them each January. They remain a longstanding ritual that blends data, optimism, and speculation.
Presented by the Investment Committee of Lake Street, an SEC Registered Investment Adviser
The information contained herein constitutes general information and is not directed to, designed for, or individually tailored to, any particular investor or potential investor. This report is not intended to be a client-specific suitability analysis or recommendation, an offer to participate in any investment, or a recommendation to buy, hold or sell securities. Do not use this report as the sole basis for investment decisions. Do not select an asset class or investment product based on performance alone. Consider all relevant information, including your existing portfolio, investment objectives, risk tolerance, liquidity needs and investment time horizon. Diversification does not ensure a profit or guarantee against a loss. There is no assurance that any investment strategy will be successful. Investing involves risk and you may incur a profit or a loss.