On the Street Monthly – Earnings Scorecard
After six straight months of gains from May through October, the market has shifted its attention to third quarter earnings. With 91 percent of S&P 500 companies reporting, the results have been strong. A large majority have exceeded expectations for both earnings and revenue, and overall earnings growth is running at 13.1 percent compared with the 7.9 percent that analysts expected at the start of the season.

(Source: FactSet)
Even with these solid numbers, stock performance around earnings releases has been fairly modest. The chart above helps explain why. Much of the improvement in corporate profits had already been reflected in stock prices before companies reported. Earnings are moving higher, but the market has been out in front of that trend, which limits the amount of upside investors typically see during the reporting period.
From a historical perspective, the market now appears extended relative to its earnings backdrop. With expectations moving higher, further gains will depend on companies following through on the growth story that has supported the market this year, including the expected benefits from increased AI spending and related productivity improvements.
Stock Market Momentum
November has historically been the strongest month of the year for investors, and this year we wanted to look at how the market tends to behave when the S&P 500 enters November with a gain of 15 percent or more.

(Source: Carson Insights)
The chart above highlights the 21 prior instances since 1950 when the market was up at least that much through the end of October. In those years, November finished higher 81% of the time and December finished higher 71% of the time. Taken together, the last two months of the year produced positive returns in 20 out of 21 cases, with an average gain of 4.7%.
The takeaway is that strong market performance through October has often led to continued strength into yearend, especially during a seasonally supportive period. While this November has started on uneven footing, a brief pause after six months of gains would be reasonable. History suggests that even with some short term volatility, the market has tended to finish the year at higher levels when entering November with this much momentum.
Sentiment Indicator
Last month, we highlighted how investor optimism had all but disappeared. The AAII Sentiment Survey, which measures how individual investors feel about the stock market over the next six months, was near historical lows on its 9/10/2025 reading. At that time, only 28% of investors were bullish, while 49.5% were bearish, with the rest neutral. After strong gains in September and October, sentiment briefly improved. This can sometimes act as a contrarian indicator, since markets often perform better when investors are pessimistic, not optimistic.
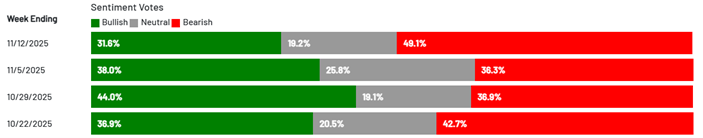
(Source: AAII Sentiment Survey)
However, as of the 11/12 weekly reading, pessimism has returned. Bullish sentiment has dropped again, and bearish sentiment has climbed, bringing us back to a more negative outlook. Interestingly, we entered November approaching one-year highs in bullish sentiment, only to see it quickly reverse.
In our previous article, we noted that year-end rallies are historically common in strong market years. With sentiment falling again, this dip in optimism could actually help set the stage for a potential year-end rally.
Articles We’re Reading
Treasury Secretary Bessent says some areas of the economy already in recession, which could spread without rate cuts (Axios)
Fed Governor Waller says labor-market concerns still pointing him toward a cut in December (Bloomberg)
Microsoft CEO sees headcount starting to rise again next year amid unlearning/relearning processes (CNBC)
Widespread mentions of OpenAI on corporate earnings calls underscore the firm’s dominance over AI and the broader market (Axios)
Market Snapshot
For the Month Ending 10/31/2025 (Cumulative Returns)1

1Source – Morningstar, Inc. Corporate Bonds is presented as the iShares iBoxx $ Investment Grade Corporate Bond ETF. Municipal Bonds is presented as the iShares National Municipal Bond ETF. High Yield Bonds is presented as the iShares iBoxx $ High Yield Corporate Bond ETF. 10 Year Treasury refers to the valuation of a 10 Year Treasury Note, a debt obligation issued by the U.S. Department of the Treasury. Fed Funds Target represents upper limit of the federal funds target range established by the Federal Open Market Committee. Inflation Rate provided for the purposes of this report by the U.S. Bureau of Labor Statistics. Unemployment Rate calculated by the U.S. Bureau of Labor Statistics. WTI Crude Oil refers to the price of a barrel of West Texas Intermediate NYMEX) Crude Oil. Gold – Spot Price relates to the valuation of an ounce of gold, as traded on the NYSE Arca Exchange. U.S. Dollar refers to the U.S. Dollar Index (DXY). All Returns are denominated in USD (United States Dollar), unless otherwise explicitly noted.
Did You Know?
The first modern U.S. government shutdown in 1976 didn’t just close agencies for ten days. It also happened for a reason that might surprise people today. The dispute wasn’t about a major political standoff but about funding for the Departments of Labor and Health, Education, and Welfare. President Gerald Ford argued that the spending levels were too high, and his veto triggered what became the first official “shutdown.” At the time, there were no detailed rules for what should stay open or closed, so many agencies improvised their plans as they went. That early shutdown helped create the guidelines that future administrations have followed ever since.
Presented by the Investment Committee of Lake Street, an SEC Registered Investment Adviser
The information contained herein constitutes general information and is not directed to, designed for, or individually tailored to, any particular investor or potential investor. This report is not intended to be a client-specific suitability analysis or recommendation, an offer to participate in any investment, or a recommendation to buy, hold or sell securities. Do not use this report as the sole basis for investment decisions. Do not select an asset class or investment product based on performance alone. Consider all relevant information, including your existing portfolio, investment objectives, risk tolerance, liquidity needs and investment time horizon. Diversification does not ensure a profit or guarantee against a loss. There is no assurance that any investment strategy will be successful. Investing involves risk and you may incur a profit or a loss.