On the Street Monthly – Dot.com vs AI Boom
Many have drawn parallels between the internet boom of the late 1990s and the recent surge in artificial intelligence. To explore that comparison, we charted the Nasdaq Composite, with the blue line representing 1995–2000 and the orange line showing performance from 2023 to the present.
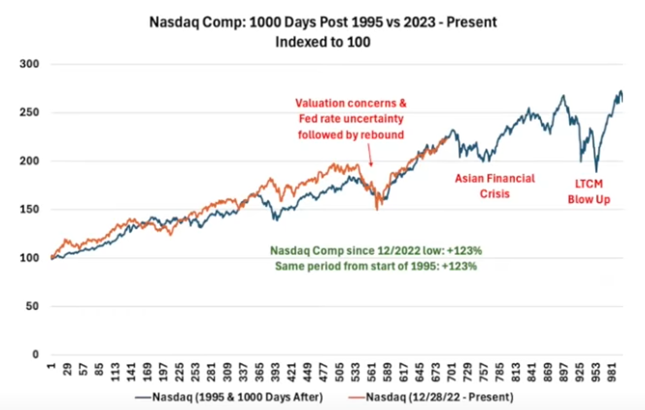
(Source: DataTrek)
While investors often recall the dot-com bubble’s collapse in 2000 with concern, it’s striking how closely these two trend lines align. Three years into the AI revolution, the Nasdaq’s returns have mirrored those of the internet era almost identically. This overlap is noteworthy because, as “AI bubble” headlines begin to surface alongside strong market gains, the data suggests that if the correlation continues, the current rally may still have room to run.
Beyond the trend lines, there are key differences between the companies driving each era. During the height of the dot-com mania, the Nasdaq’s price-to-earnings ratio reached around 200. Today, it trades closer to 41.5 times earnings, reflecting a far stronger earnings foundation among today’s AI leaders. If speculation intensifies and valuations expand, we could see the resemblance to the dot-com era grow—but for now, the data implies there’s still time left on the clock for the AI trade.
Market Strength & Q4 Impacts
The third quarter, typically a seasonally weaker period, ended on a strong note. Through the first nine months of the year, the S&P 500 is up 13.7% year to date. This marks the 31st time since 1950 that the index has gained more than 10% through September which has been historically a positive signal for the months ahead.

(Source: Carson Insights)
As the chart above illustrates, in those prior 30 instances, October produced mixed results, but the fourth quarter finished higher 83% of the time with an average gain of 4.3%. We’ve noted in previous reports that strong market trends often persist, and that pattern has continued to play out. While past performance is never guaranteed, history suggests that markets with solid momentum tend to carry that strength forward and it would not be surprising if 2025 continues that path.
Where is the Optimism?
One of our preferred measures of market sentiment is the AAII Investor Sentiment Survey, which gauges how individual investors feel about the stock market over the next six months. Below are the survey results as of October 1, 2025.
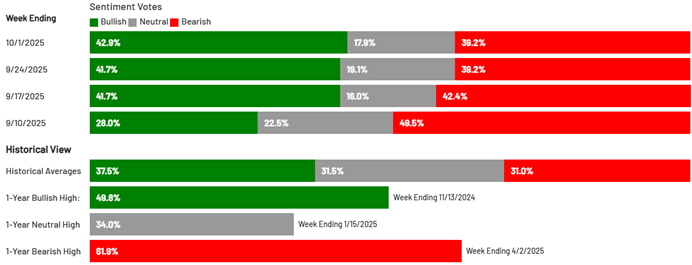
(Source: AAII)
At the start of September, bearish sentiment remained the prevailing theme, with 49.5% of respondents bearish compared to just 28% bullish. As markets strengthened through the month, optimism has rebounded with bulls now edging out bears.
This indicator has proven valuable over time. For example, the most bearish reading of the past year occurred on April 2, 2025 which was right after the tariff announcement. Since then, the S&P 500 has risen more than 18%. This highlights why monitoring sentiment can be useful, especially when it diverges sharply from historical norms. Today’s readings suggest that investors are neither overly optimistic nor excessively pessimistic, offering a balanced backdrop as we head into year-end.
Articles We’re Reading
Labor markets in many leading economies in ‘low-hire, low-fire’ cycle with paralysis a function of trade uncertainty and AI (FT)
Federal-worker buyouts staring to kick in, providing another input for broader labor market slowdown (link)
OpenAI and designer Jony Ive wrangling with a series of technical issues facing secretive new AI device (FT)
Attractive yields, Fed easing, solid macro backdrop, strong corporate balance sheets, scarcity of bonds among factors driving tight IG spreads (link)
Market Snapshot
For the Month Ending 9/30/2025 (Cumulative Returns)1

1Source – Morningstar, Inc. Corporate Bonds is presented as the iShares iBoxx $ Investment Grade Corporate Bond ETF. Municipal Bonds is presented as the iShares National Municipal Bond ETF. High Yield Bonds is presented as the iShares iBoxx $ High Yield Corporate Bond ETF. 10 Year Treasury refers to the valuation of a 10 Year Treasury Note, a debt obligation issued by the U.S. Department of the Treasury. Fed Funds Target represents upper limit of the federal funds target range established by the Federal Open Market Committee. Inflation Rate provided for the purposes of this report by the U.S. Bureau of Labor Statistics. Unemployment Rate calculated by the U.S. Bureau of Labor Statistics. WTI Crude Oil refers to the price of a barrel of West Texas Intermediate NYMEX) Crude Oil. Gold – Spot Price relates to the valuation of an ounce of gold, as traded on the NYSE Arca Exchange. U.S. Dollar refers to the U.S. Dollar Index (DXY). All Returns are denominated in USD (United States Dollar), unless otherwise explicitly noted.
Did You Know?
Tucked just outside Peoria, Morton, Illinois proudly calls itself the Pumpkin Capital of the World and for good reason. Each fall, this small town becomes the epicenter of America’s pumpkin obsession, producing about 85% of the world’s canned pumpkin supply.
The Libby’s processing plant in Morton runs around the clock during harvest season, transforming more than 100,000 tons of pumpkins into the purée that ends up in everything from Thanksgiving pies to Starbucks lattes. Morton’s population is just over 17,000, yet its farmers and factory workers quite literally fuel fall traditions for millions.
Presented by the Investment Committee of Lake Street, an SEC Registered Investment Adviser
The information contained herein constitutes general information and is not directed to, designed for, or individually tailored to, any particular investor or potential investor. This report is not intended to be a client-specific suitability analysis or recommendation, an offer to participate in any investment, or a recommendation to buy, hold or sell securities. Do not use this report as the sole basis for investment decisions. Do not select an asset class or investment product based on performance alone. Consider all relevant information, including your existing portfolio, investment objectives, risk tolerance, liquidity needs and investment time horizon. Diversification does not ensure a profit or guarantee against a loss. There is no assurance that any investment strategy will be successful. Investing involves risk and you may incur a profit or a loss.