On the Street Monthly – Market Implications if the Fed Cuts
The Federal Reserve meets next week, and the futures market is signaling a 91.8% chance of a rate cut. The remaining 8.2% even suggests the possibility of two cuts — meaning the market is fully expecting at least a quarter-point (25bps) reduction.
Typically, rate cuts are associated with a struggling economy or falling markets. But this time is different: the Fed may cut while stocks are trading within 2% of all-time highs. That raised the interesting question — how has the market responded in the past when cuts happened at or near record levels?

(Source: FactSet, Carson Investment Research)
Looking back to 1980, history shows that in the month after these kinds of cuts, performance is mixed with stocks rising about half the time. But when you extend the view to 12 months out, the market has been positive in every instance with an average return of 13.9%.
While it remains to be seen whether we’ll stay within 2% of the highs when the Fed makes its decision, history suggests that rate cuts near record levels have been a bullish signal for the year ahead.
Market Concentration
Over the past decade, the stock market has become increasingly dominated by a small group of very large companies. You may have heard them referred to as FANG, FAANG, or more recently the Magnificent Seven. While the names have changed, the story has stayed the same — a handful of big tech and growth companies have driven much of the market’s performance.
Today, the top 10 stocks in the S&P 500 make up about 38% of the index. That’s why you may see headlines pointing out higher valuations compared to history. But this isn’t new — markets have gone through similar periods of concentration before.

(Source: Carson Insights)
The chart above highlights the pattern: when the biggest companies lead, they can outperform for years at a time. Eventually, though, leadership shifts back to the broader market. These shifts are part of a natural cycle, not something to fear.
The key takeaway: whether it’s the “biggest names” or the “rest of the market” in the driver’s seat, these trends tend to last for a while. No one can predict exactly when they’ll turn, but history suggests they always do. That’s why diversification matters — it helps ensure your portfolio is prepared no matter which part of the market is leading.
This trend isn’t unique to the United States. The chart below shows the top 10 stocks by country, and the U.S. actually ranks toward the lower end of the list. While our market is far larger and deeper than most, history shows that the U.S. has generally stayed on the less concentrated side compared to other countries.

(Source: Carson Insights)
It’s also worth noting that a large part of today’s economy isn’t represented in public markets at all. The private equity boom has created more than 1,000 privately held companies valued at over $1 billion. This growing universe of private businesses adds a layer of diversification to the economy that didn’t exist in the past — and may help explain why public markets appear more concentrated today.
A Growing Divide in Economic Sentiment
It probably won’t surprise you that people with higher incomes tend to feel more optimistic about the economy than those with lower incomes. But something new has emerged in recent months that could have meaningful societal implications.
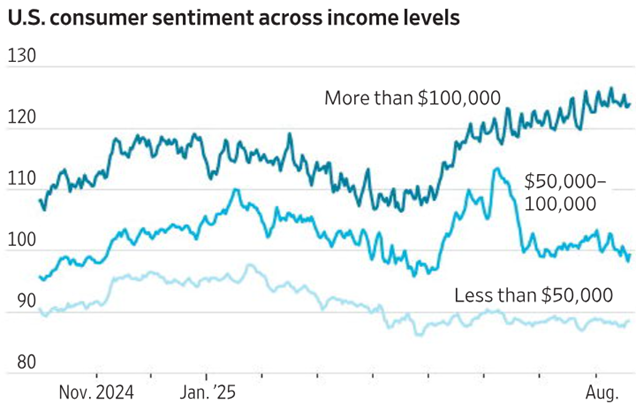
For most of the period shown, sentiment across income levels moved in the same general direction. While wealthier households consistently reported feeling better than lower-income households, at least the trendlines rose and fell together. That changed this summer. Starting in June, households earning less than six figures saw their confidence drop sharply. At the same time, households making six figures or more actually became more optimistic. This type of divergence is unusual — sentiment rarely breaks so clearly along income lines.
In our view, this isn’t just about income but also about assets. Rising markets and record highs have boosted portfolios, retirement accounts, and other investments for higher-income households, masking some of the underlying economic weakness. For families living paycheck to paycheck, however, those market gains haven’t provided much relief.
There’s no quick solution here and it’s an important trend to keep in mind as we think about the health of the economy and how it feels very different depending on where you stand financially.
Articles We’re Reading
Judge orders search shakeup in Google monopoly case, but keeps hands off Chrome & default deals AP
AI start-up Anthropic valued at $170bn in expanded funding round FT
U.S. Treasury yields brush with 5% as global borrowing costs mount BBG
Trump will ask Supreme Court for ‘expedited ruling’ on tariffs appeal CNBC
Market Snapshot
For the Month Ending 8/31/2025 (Cumulative Returns)1
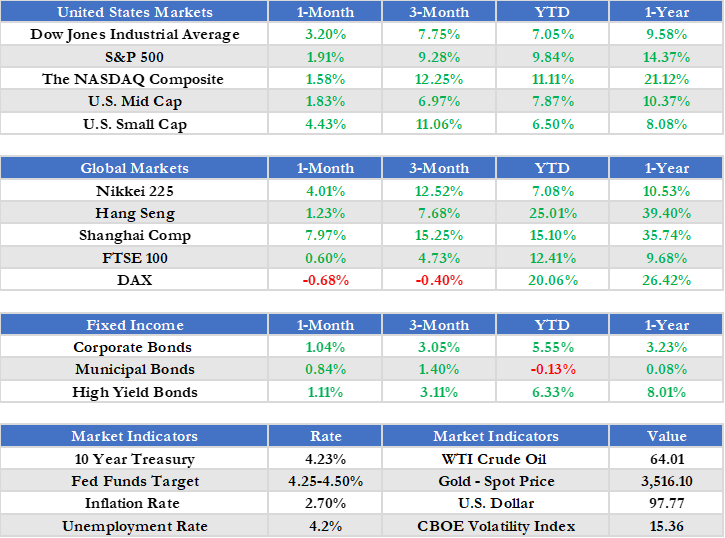
1Source – Morningstar, Inc. Corporate Bonds is presented as the iShares iBoxx $ Investment Grade Corporate Bond ETF. Municipal Bonds is presented as the iShares National Municipal Bond ETF. High Yield Bonds is presented as the iShares iBoxx $ High Yield Corporate Bond ETF. 10 Year Treasury refers to the valuation of a 10 Year Treasury Note, a debt obligation issued by the U.S. Department of the Treasury. Fed Funds Target represents upper limit of the federal funds target range established by the Federal Open Market Committee. Inflation Rate provided for the purposes of this report by the U.S. Bureau of Labor Statistics. Unemployment Rate calculated by the U.S. Bureau of Labor Statistics. WTI Crude Oil refers to the price of a barrel of West Texas Intermediate NYMEX) Crude Oil. Gold – Spot Price relates to the valuation of an ounce of gold, as traded on the NYSE Arca Exchange. U.S. Dollar refers to the U.S. Dollar Index (DXY). All Returns are denominated in USD (United States Dollar), unless otherwise explicitly noted.
Did You Know?
Labor Day was first celebrated in 1882 in New York City as a way to honor the contributions of American workers. It became a federal holiday in 1894, and today it not only marks the unofficial end of summer but also serves as a reminder of the role hard work and innovation play in driving our economy forward.
The first Labor Day parade in 1882 featured 10,000 workers marching through Manhattan, many carrying signs that demanded a five-day, 40-hour work week — at a time when a typical schedule was six days and 60 hours or more. That demand eventually became the standard decades later, reshaping work and life in America.
Presented by the Investment Committee of Lake Street, an SEC Registered Investment Adviser
The information contained herein constitutes general information and is not directed to, designed for, or individually tailored to, any particular investor or potential investor. This report is not intended to be a client-specific suitability analysis or recommendation, an offer to participate in any investment, or a recommendation to buy, hold or sell securities. Do not use this report as the sole basis for investment decisions. Do not select an asset class or investment product based on performance alone. Consider all relevant information, including your existing portfolio, investment objectives, risk tolerance, liquidity needs and investment time horizon. Diversification does not ensure a profit or guarantee against a loss. There is no assurance that any investment strategy will be successful. Investing involves risk and you may incur a profit or a loss.